
HaloCORE DSI
HaloCORE DSI (Data Stream Intelligence) allows displaying and analyzing the data exchange between an SAP NetWeaver system and other (SAP or non-SAP) systems, servers, or other partners. It does so by collecting communication metadata from a variety of sources, and classifying, formatting, and displaying it in a common format.
Installing HaloCORE DSI
Prerequisite: Before you begin the installation, make sure that you have installed HaloCORE for NetWeaver beforehand as described in the section "Install the NetWeaver Add-On".
Note: HaloCORE DSI is supported from 7.02 and above only.
Add-ons and Support Packages
Sometimes HaloCORE Add-on comes along with support packages that contain quality improvements or bug fixes. So, please check the delivery package and import them accordingly as recommended below:
With transaction SAINT, import the packages, including the support packages.
Or with transaction SAINT, import the main packages and then use the transaction SPAM to import the support packages.
SOURCE CODE IN TEXT FILES
The source code is delivered with the software package as text files …\HaloCORE DSI\1_Installation\ABAP Source. Please make sure that you copy the code only from the text files delivered, not the source embedded in the manual, and the screenshots are only indicative.
Step 1. Import the Add-On Packages
With transaction SAINT, import the packages:
With transaction SAINT, import the
.SARfiles from your installation package<product version>\HaloCORE for NetWeaver\1_Installation\Data\K-[...].SAR:Logon to client 000 with a user having SAP_ALL authorizations (but not with DDIC or SAP*).
In the menu option, click Installation Package > Load Packages > select Front End option.
Choose a SAR file from the selection window.
Note: The SAP GUI Security dialog may or may not appear depending on the user's GUI settings. On the GUI settings, click the Allow button.
When prompted, click Decompress.
After decompression, a message such as File 'k-a11coinsecudeh1.sar' successfully transferred, decompressed, and deleted will appear.
Press Start to view your package queue.
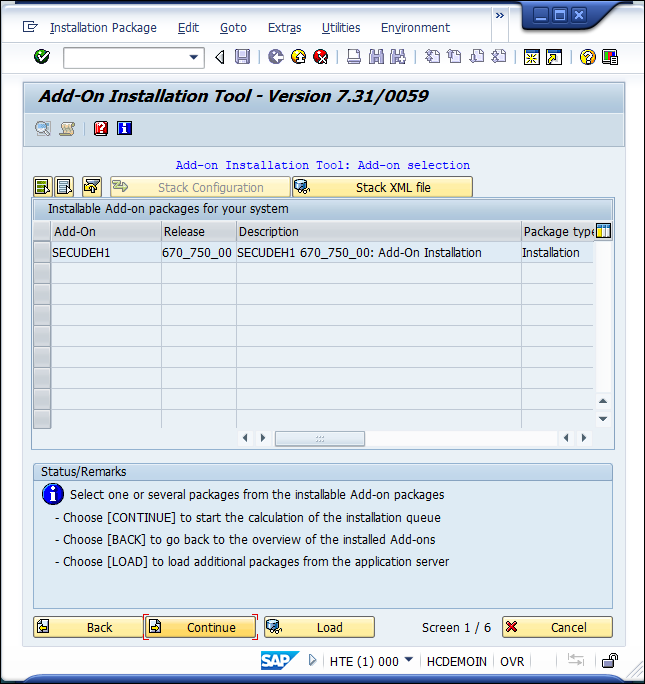
Installing HaloCORE DSI
Select the SECUDEH1 Add-On and click Continue.
Click Continue again.
To the question "Do you want to add Modification Adjustment Transports to the queue?", answer No.
You may choose to run the import in dialog or the background. (The import process may run for 30 minutes or longer, depending on various factors.)
Click the Finish button.
Step 2. Import Standard Configuration
Log on to the client where you want to import the settings (not client 000), with a user with SAP_ALL authorizations.
Run transaction /n/SECUDECO/INSTALLER.
In the Directory input field, click on the input help (or) press the F4 key.
The Browse For Folder dialog appears.
Select the directory containing the XML files with the settings (
Secude[…]_nnn.XML)The XML files reside on your installation package
<product version>\HaloCORE DSI\2_Configuration\Please note that files with a too-long file path cannot be uploaded. Hence, make sure that the complete path (including the file name) does not exceed 128 characters.
Click Upload contents from XML files and Add New and Replace Existing options.
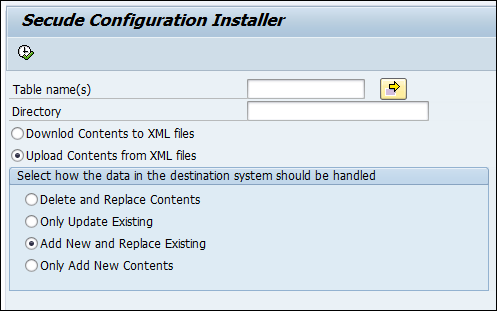
Uploading XML files
From the menu, select Program > Execute or just press F8.
Click OK. Please be patient until the files are uploaded. On successful upload, you can see the upload information in the log.
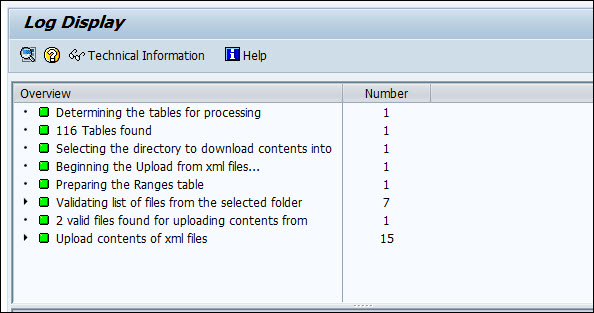
Upload log information
Restricted Content
Some sections of our documentation portal are exclusively available to licensed customers. If you are a licensed user, please log in to https://tech.secude.com to continue.
Setting up the Add-On
Once installation is completed, you can view the main menu of HaloCORE DSI. You can call this menu from the SAP Easy Access Menu, by typing the area menu /n/SECUDEH1/ into the command field.
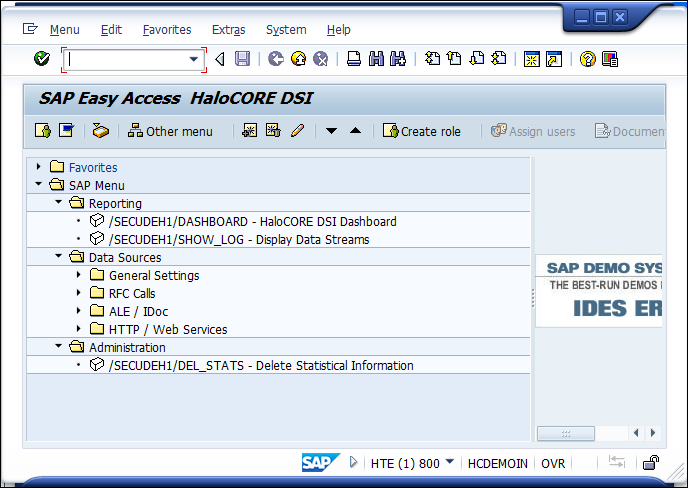
Main menu
Logical Entities
A (logical) entity is a system, server, machine, or other logical processing or storage unit by and with which data is exchanged. There are various ways how exactly the same system can look in the data log. An entity can correspond to an SAP "logical system" (i.e., a client on an SAP system), a cloud tenant (e.g., an MS Azure tenant), a Windows or Java server instance, and so on. One and the same communication partner can be represented, for instance, as:
an SAP System ID (SID) plus client
an SAP Logical System
an SAP Server, with or without client
an SAP Host Name plus Client
an RFC destination
a Host Name
an IP address
an internet domain
To allow a common representation of all these ways of identifying a communication partner, it is strongly recommended to define a "Logical Entity" for each communication partner and to map its various representations to that Logical Entity. Logical entities are not persisted with the communication data, so you can change keys and mappings at any time, and changes will be reflected also when reporting on older data.
Define Logical Entities
A Logical Entity mainly consists of
a key (20 characters, proper case), which you may want to make speaking to some extent
a language-dependent name
Follow the below procedure to define logical entities:
Call transaction /n/SECUDEH1/LOGENT – Define Logical Entities.
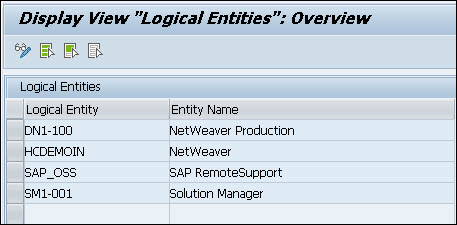
Logical Entities
Click Display −> Change icon to edit the table.
Enter the Logical Entity and Entity Name in the respective text boxes.
Click Save to save your settings.
Map Logical Entities
As described above, the same logical entity can be identified differently in the communication log data, depending on the communication method and partner type.
Examples:
For IDocs, that should always be the SAP Logical Systems
For RFCs, that could be:
SAP server name + client (HOST1234_P01_00+100)
SAP System ID + client (P01+100)
Hostname (HOST1234) if not called from ABAP
IP address (10.1.11.111) if host unknown and not called from ABAP
For HTTP or web service calls, this could typically be:
SAP server name (HOST1234_P01_00)
The server name represented as FQDN (
host1234.example.com)IP address (10.1.11.111).
To map the logical entity and its technical type, follow the below steps:
Call transaction /n/SECUDEH1/LOGENTMAP – Map Logical Entities.
Click Display −> Change icon to edit the table.
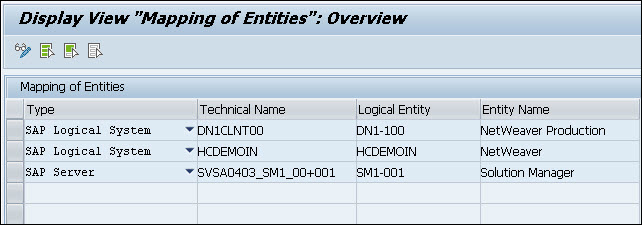
Mapping of Entities
Select the Type of logical entity and Technical Name of the entry you want to map (the Technical Name is not case-sensitive; wildcards are not supported).
Enter the Logical Entity you want to map this entry to.
Click Save to save your settings.
Configure Event Logging/Display
Transaction /SECUDEH1/EVTCFG directly influences the options that are selectable in HaloCORE DSI Dashboard.
You may activate and deactivate individual event types, such as RFC Calls (Inbound and Outbound), HTTP Calls (Inbound and Outbound), and IDocs (Inbound and Outbound). When logging for a specific type of event is deactivated, related data will not be collected, and will not appear on the dashboard list. This reduces system workload for data that you are not interested in.
By default, all options are initially deactivated. Unless you select an option, there will be nothing displayed in the dashboard.
To activate / deactivate the events, proceed as follows:
Call transaction /n/SECUDEH1/EVTCFG - Configure Event Logging/Display.
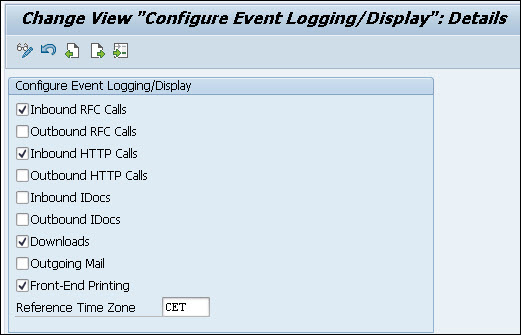
Configure Event Logging/Display
Click Display −> Change icon to edit the options.
Activate/deactivate the following events:
Inbound RFC Calls
Outbound RFC Calls
Inbound HTTP Calls
Outbound HTTP Calls
Inbound IDocs
Outbound IDocs
Downloads1
Outgoing Mail1
Front-End Printing1
Enter the Time Zone used for the aggregation of the RFC and HTTP log data. (For example, if aggregation to days is chosen, this time zone determines when a day begins and ends). By default, the time zone is set to the system's local time zone.
Click Save to save your settings.
Footnote 1
These three options take effect only if HaloCORE (standard or starter pack) is implemented and active.
Configure Aggregation
To reduce the amount of data to be stored and reported on, raw data is aggregated, i.e., similar events that occur within a specified amount of time are collected into one record.
Aggregation occurs as follows:
Initially, when data is first collected, it is aggregated according to the setting in the field "Initial Aggregation Level"; as data collection occurs hourly, a reasonable setting (depending on the amount of traffic on your system) could be seconds, minutes, or hours.
Subsequently, data can be further aggregated as it ages. You could configure the system in such a way that data that is older than, say, 3 days, is aggregated to entire days (i.e., all similar events that have occurred within the same day are collected into one record); and after 3 months, data is further aggregated into monthly records.
Once the above process is over, you can send the data to the SIEM System via HaloENGINE.
To configure aggregation settings, proceed as follows:
Call transaction /n/SECUDEH1/AGGR - Configure Aggregation.
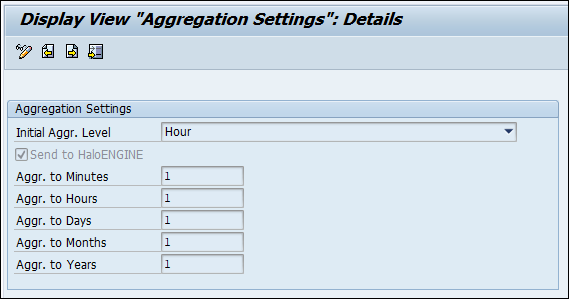
Configure Aggregation
Click Display −> Change icon to edit the options.
In the settings screen, you can use the following options to aggregate the data:
Initial Aggr.Level – aggregation at initial data collection (see above)
Aggr. to Minutes – aggregate to minutes after ‘n’ minutes.
Aggr. to Hours – aggregate to hours after ‘n’ hours.
Aggr. to Days – aggregate to days after ‘n’ days.
Aggr. to Months – aggregate to months after ‘n’ months.
Aggr. to Years – aggregate to years after ‘n’ years.
Click Save to save your settings. [If you do not wish to aggregate at a certain level, instead of a number, you can enter a dash (-).]
Select Send to HaloENGINE check box to forward the logs to HaloENGINE.
RFC Calls
Principle
The metadata of RFC communication is extracted from SAP's workload statistics (as displayed with transaction STAD).
The fully detailed data of these statistics have a limited lifetime of only a few days (depending on system settings), and only a small fraction of it is relevant for HaloCORE DSI. For this reason, relevant data is extracted and persisted during the hourly statistics data extraction run (standard job SAP_COLLECTOR_FOR_PERFMONITOR). BAdI WORKLOAD_STATISTIC is explicitly built for this purpose.
Client Dependence of Statistics
The standard SAP statistics extraction runs on client 000 and collects data related to all clients in the system. The classification of the data, however, heavily relies on data stored within the individual clients. HaloCORE, therefore, uses a two-step process to prepare the RFC-related data:
The statistics extraction (job SAP_COLLECTOR_FOR_PERFMONITOR and BAdI WORKLOAD_STATISTIC) runs on client 000 but will populate the client-dependent extract table /SECUDEH1/200 in all clients (client-specific whitelists are considered).
Data classification occurs as a subsequent step, directly in those clients where it is appropriate, according to the configuration specific to each client.
Maintaining the Whitelist
To avoid persisting more data than required, the statistics extraction logic will skip local RFC calls (i.e., that are internal within a given system and client). In addition, specific partner entities or function names can be whitelisted, too, so that traffic that is known to be innocuous or not interesting for deeper analysis can be suppressed.
To maintain the whitelist, proceed as follows:
Call transaction /n/SECUDEH1/RFC_WL – Maintain RFC Whitelist.
Click Display −> Change icon to edit the options.
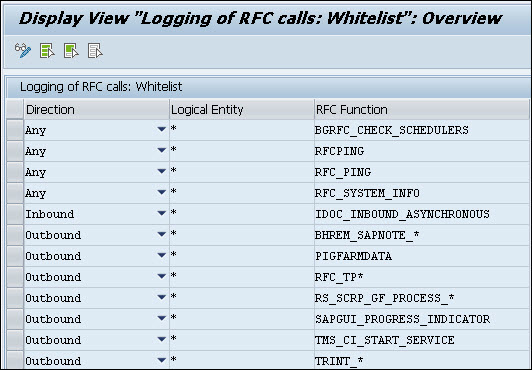
Logging of RFC Calls
Enter the Direction (Inbound/Outbound/Any), Logical Entity, and RFC Function in the respective text boxes. Note: Wildcards are supported in this table.
Click Save to save your settings.
Classification: Mapping of RFC communications
RFC communications are classified based on the following sources:
Direct mapping of the called RFC function module.
If the function itself is not mapped from the function group's package and application component/hierarchy (standard HaloCORE for NetWeaver classification derivation).
To map individual function modules, proceed as follows:
Call transaction /n/SECUDEH1/MAP_FUNC – Mapping of Function Modules.
Click Display −> Change icon to edit the table.
Enter the values for the following:
RFC Function
Counter (technical field; enter a consecutive number if you want to maintain several lines for the same function)
Attribute (technical name of the attribute)
Attribute Value
Reliability (unspecified/Indicative/Probable/Authoritative)
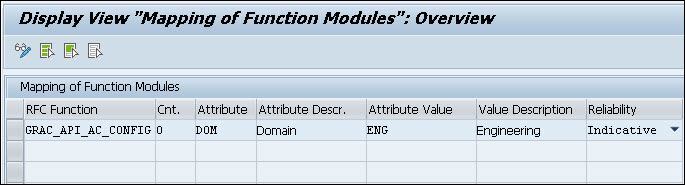
Mapping of Function Modules
Click Save to save your settings.
Read Workload Statistics
For test purposes, you can execute transaction /SECUDEH1/READ_WLSTA (program /SECUDEH1/READ_WL_STATS). This will perform the same extraction process as the WORKLOAD_STATISTIC BAdI but is limited to and specific to the client on which you execute it. It accesses the raw data in the statistics files (see SAP note 6833 for background), extracts and classifies it.
If you run the program repeatedly with overlapping periods, or in addition to the standard workload collector background job, it will produce duplicate data in the database (unless it is executed in test mode).
Call transaction /n/SECUDEH1/READ_WLSTA – Read Workload Statistics.
Select a specific date range in From Date/Time and To Date/Time fields. Please be aware that, depending on the amount of traffic in your system, specifying a long interval here could produce a very large set of data.
Enter the Time Zone to which the above dates refer.
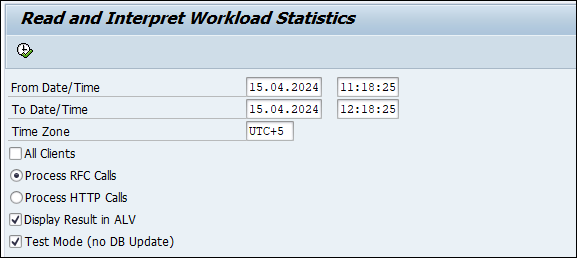
Read and Interpret Workload Statistics
Enter the source of the extraction process.
All Clients (if not checked, only calls to/from the current client are read)
Process RFC Calls or Process HTTP Calls
If you want to view the data in the ALV grid, select Display Result in the ALV check box. If you just want to run the program without database update for testing purposes, select the Test Mode (no DB Update) check box.
Click Execute or press F8.
Depending on the interval specified and the amount of data, it could take some time to display the workload statistics table.
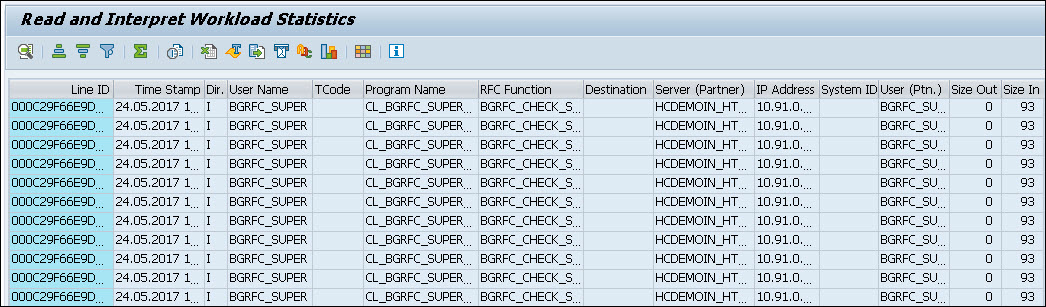
Read and Interpret Workload Statistics log result
Process Workload Statistics (RFC)
The raw data collected by the performance monitor plug-in must be compressed, aggregated, and classified before it can be used for reporting. For this reason, program /SECUDEH1/PROCESS_WL_STATS must be scheduled to run at regular intervals, ideally hourly, and after the standard job SAP_COLLECTOR_FOR_PERFMONITOR. You should create a variant with the following settings:
Data Selection: Process RFC Calls
Maximum No. of Hits: 100'000
Store New Log Entries: Yes
Aggregate Log Entries: Yes
Test Mode (No DB Update): No
You can also execute this report manually, as follows.
Call transaction /n/SECUDEH1/WLSTA_RFC - Process Workload Statistics.
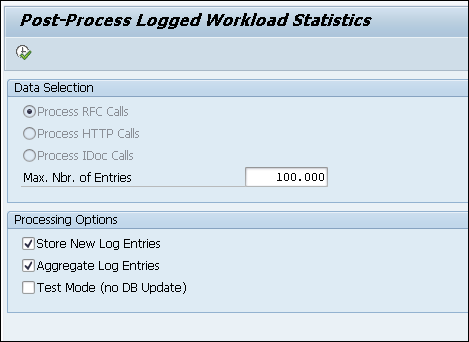
Process Workload Statistics
Data Selection is defaulted to RFC calls.
Enter the number of entries to be processed in one program run in Maximum No. of Hits (defaulted to 100'000).
Select the processing options:
Store New Log Entries – initial aggregation and classification of raw data into log tables.
Aggregate Log Entries – subsequent aggregation of already present records in tables to larger units (Minutes\Hours\Dates\Months\Years).
Select Test Mode (no DB Update) check box to run the program without database update for testing purposes.
Click Execute or press F8.
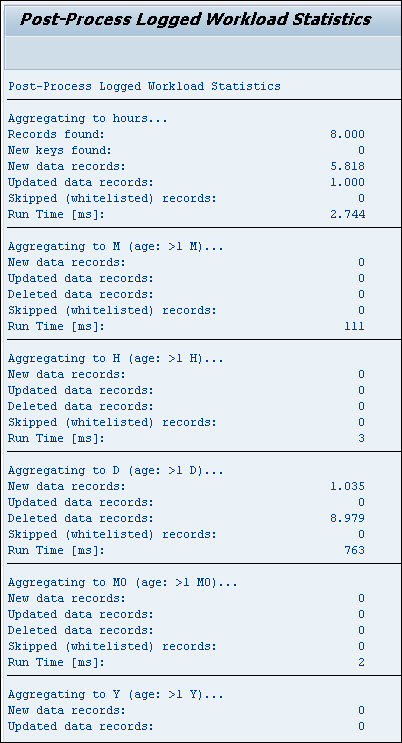
Process Workload result
Send Statistical Information (RFC)
Use this program to send RFC calls to HaloENGINE.
Prerequisites:
HaloENGINE must be configured with Monitor properties and enabled for DSI Monitoring.
A logical port must be created to send audit logs to the HaloENGINE. Please refer to the section "Monitor Interface".
The log must be configured as described in the section "Forwarding Logs to HaloENGINE" to send audit logs to HaloENGINE.
Send to Central Server check box must be selected as described in the section "Configure Aggregation".
Follow the below steps to forward logs to the HaloENGINE:
Call transaction /n/SECUDEH1/SEND_RFC – Send Statistical Information (RFC).
Click Display −> Change icon to edit the table.
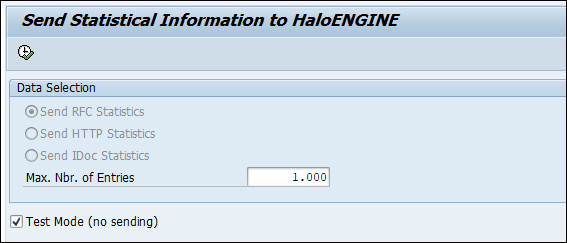
Send Statistical Information - RFC
Enter the number of entries to be sent in one program run in Maximum Nbr. of Entries (defaulted to 1.000).
Select Test Mode (no sending) check box to run the program without sending it for testing purposes.
Click Execute or press F8.
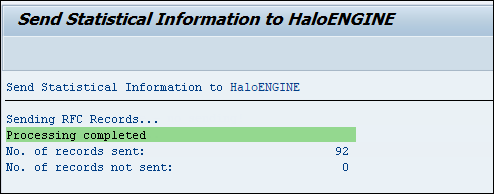
Statistical information to HaloENGINE
For illustration purposes, a sample RFC log entry that is sent to the HaloENGINE is shown below:
|
|---|
ALE/IDOC
Principle
IDoc communication metadata is extracted from SAP's message status and definition tables (EDIDC and others), classified and collected in specific database tables.
Classification: Mapping of Messages
IDocs can be classified based on their message type, the segments they contain, individual fields, and even values of specific fields in a segment. (If no such mapping can be found, the package and application component of the IDoc Basic Type is used for derivation.)
To maintain mappings for IDoc types, proceed as follows:
Call transaction /n/SECUDEH1/MAP_IDOC – Mapping of IDocs.
Click Display −> Change icon to edit the table.
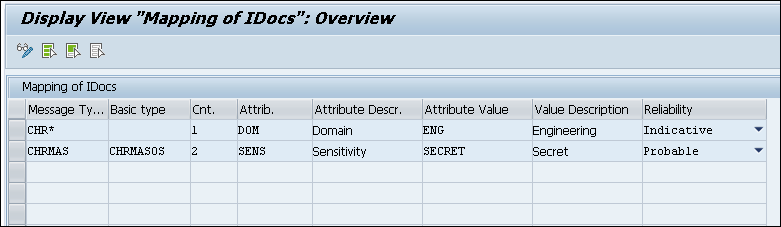
Mapping of IDocs
Enter the values for the following:
Message Type
Basic type (optional)
Counter (technical field; enter a consecutive number if you want to maintain several lines for the same combination of key fields)
Attribute
Attribute Value
Reliability
Note: Wildcards are supported in this table.
Click Save to save your settings.
Extraction: Scheduling the Background Job
Program /SECUDEH1/READ_IDOCS must be scheduled to extract the standard SAP database tables and classify records. It can also be run manually from transaction /SECUDEH1/READ_IDOCS.
In the selection screen, you can use the following options to restrict the processing of IDocs:
Selection by Date
Selection by Time
Direction for IDoc.
IDoc number
IDoc Status
Message Type
Basic type
Sender partner no.
Receiv. Partner No.
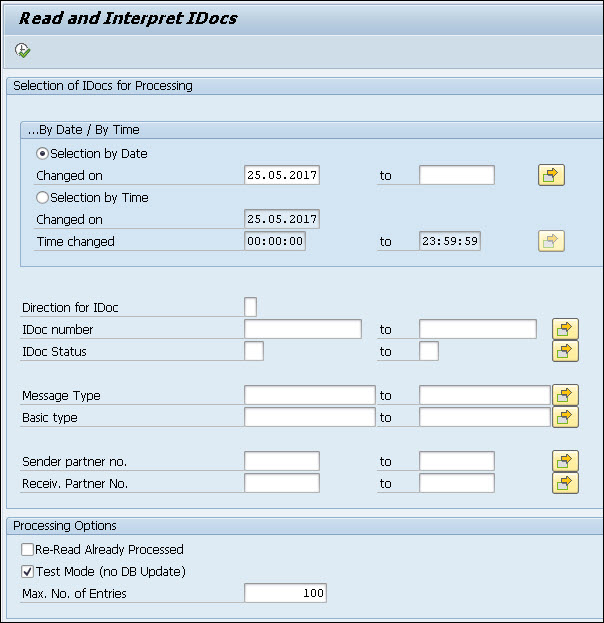
Read and Interpret IDocs
If you want to reprocess already processed IDocs, select the Re-read Already Processed check box. This can, for instance be useful after changing classification mappings.
If you just want to run the program without database update for testing purposes, select the Test Mode (no DB Update) check box.
In Maximum No. of Hits, enter the number of IDocs to be processed in the program run. By default, this value is set to 100.
Click Execute or press F8.
The log result will be displayed.
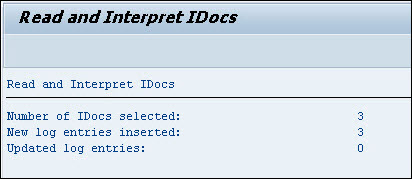
Read and Interpret of IDocs log result
Process Workload Statistics (IDoc)
The raw data collected by the performance monitor plug-in must be compressed, aggregated, and classified before it can be used for reporting. For this reason, program /SECUDEH1/PROCESS_WL_STATS must be scheduled to run at regular intervals, ideally hourly, and after the standard job SAP_COLLECTOR_FOR_PERFMONITOR. You should create a variant with the following settings:
Data Selection: Process IDoc Calls
Maximum No. of Hits: 100'000
Store New Log Entries: Yes
Aggregate Log Entries: Yes
Test Mode (No DB Update): No
You can also execute this report manually, as follows.
Call transaction /n/SECUDEH1/WLSTA_IDoc - Process Workload Statistics.
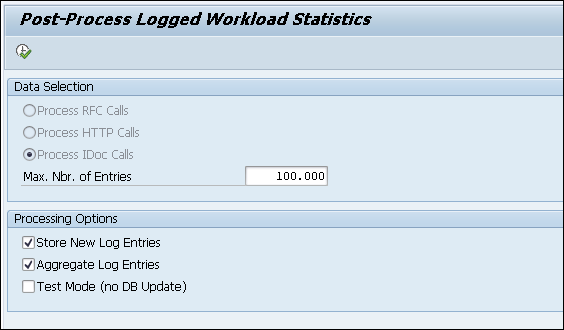
Process Workload Statistics - IDoc
Data Selection is defaulted to IDoc calls.
Enter the number of entries to be processed in one program run in Maximum No. of Hits (defaulted to 100'000).
Select the processing options:
Store New Log Entries – initial aggregation and classification of raw data into log tables.
Aggregate Log Entries – subsequent aggregation of already present records in tables to larger units (Minutes\Hours\Dates\Months\Years).
Select Test Mode (no DB Update) check box to run the program without database update for testing purposes.
Click Execute or press F8.
Process Workload result
Send Statistical Information (IDoc)
Use this program to send IDoc calls to the HaloENGINE.
Prerequisites:
HaloENGINE must be configured with Monitor properties and enabled for DSI Monitoring.
A logical port for audit must be created in the SOA Manager. Please refer to the section "Monitor Interface".
The log must be configured as described in the section "Forwarding Logs to HaloENGINE" to send audit logs to HaloENGINE.
Send to Central Server check box must be selected as described in the section "Configure Aggregation".
Follow the below steps to forward logs to HaloENGINE:
Call transaction /n/SECUDEH1/SEND_IDOC – Send Statistical Information (IDoc).
Click Display −> Change icon to edit the table.
Send Statistical Information - IDOC
Enter the number of entries to be sent in one program run in Maximum Nbr. of Entries (defaulted to 1.000).
Select Test Mode (no sending) check box to run the program without sending it for testing purposes.
Click Execute or press F8.
Statistical information to HaloENGINE - IDoc
For illustration purposes, a sample IDoc log entry that is sent to HaloENGINE is shown below:
|
|---|
HTTP/Web Services
Principle
Metadata of HTTP communication is extracted from SAP's workload statistics (as can be displayed with transaction STAD).
Client Dependence of Statistics
The standard SAP statistics extraction runs on client 000 and collects data related to all clients on the system. The classification of the data, however, heavily relies on data stored within the individual clients. HaloCORE, therefore, uses a two-step process to prepare the HTTP-related data:
The statistics extraction (job SAP_COLLECTOR_FOR_PERFMONITOR and BAdI WORKLOAD_STATISTIC) runs on client 000 but will populate the client-dependent extract table /SECUDEH1/400 in all clients (client-specific whitelists are considered).
Data classification occurs as a subsequent step, directly in those clients where it is appropriate, according to the configuration specific to each client.
Maintaining the Whitelist
To avoid persisting more data than required, the statistics extraction logic will skip HTTP/Web Service calls (i.e., that are internal within a given system and client). To maintain the whitelist, proceed as follows:
Call transaction /n/SECUDEH1/HTTP_WL – Maintain RFC Whitelist.
Click Display −> Change icon to edit the table.
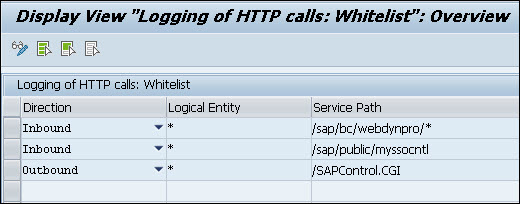
Logging of HTTP Calls
Enter the Direction. (Inbound/Outbound/Any), Logical Entity and Service Path are the respective text boxes. Note: Wildcards are supported in this table.
Click Save to save your settings.
Classification: Mapping of HTTP/Web Service communications
HTTP/Web Service communications are classified based on the following sources:
Direct mapping of the called HTTP/Web Service or path.
If the service or path itself is not mapped, but a Web Service could be identified (inbound calls only): from the Web Service's package and application component/hierarchy (standard HaloCORE for NetWeaver classification derivation).
To map individual Web Services or service paths, proceed as follows:
Call transaction /n/SECUDEH1/MAP_HTTP – Mapping of Services.
Click Display −> Change icon to edit the table.
Enter the values for the following:
Type of Entry (Web Service Name or Service Path)
Service Name or Path (wildcards are supported)
Direction (Inbound/Outbound/Any)
Counter (technical field; enter a consecutive number if you want to maintain several lines for the same function)
Attribute (technical name of the attribute)
Attribute Value
Reliability (Unspecified/Indicative/Probable/Authoritative)
Click Save to save your settings.
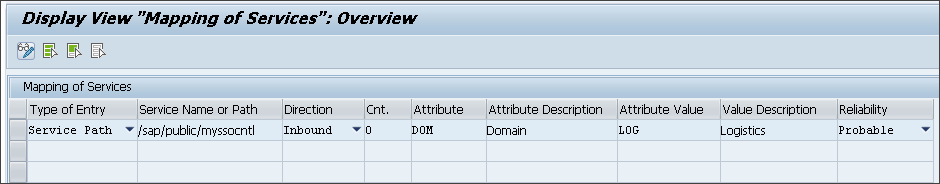
Mapping of Services
Read Workload Statistics
For test purposes, you can execute transaction /SECUDEH1/READ_WLSTA (program /SECUDEH1/READ_WL_STATS), as described under the section RFC Calls "Read Workload Statistics" by selecting the option Process HTTP Calls.
Process Workload Statistics (HTTP)
As for RFC calls (see section Process Workload Statistics (RFC)), program /SECUDEH1/PROCESS_WL_STATS must be scheduled as a background job. You should create a variant with the following settings:
Data Selection: Process HTTP Calls
Maximum No. of Hits: 100'000
Store New Log Entries: Yes
Aggregate Log Entries: Yes
Test Mode (No DB Update): No
You can also execute this report manually, as follows.
Call transaction /n/SECUDEH1/WLSTA_HTTP - Process Workload Statistics.

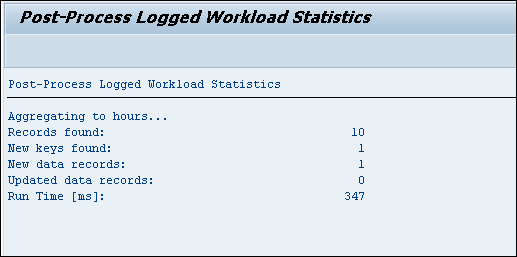
Process Workload Statistics HTTP
Data Selection is defaulted to HTTP calls.
Enter the number of entries to be processed in one program run in Maximum No. of Hits (defaulted to 100'000).
Select the processing options:
Store New Log Entries – initial aggregation and classification of raw data into log tables.
Aggregate Log Entries - subsequent aggregation of already present records in tables to larger units (Minutes\Hours\Dates\Months\Years).
Test Mode (no DB Update) – to run the program without database update for testing purposes, select the Test Mode (no DB Update) check box.
Click Execute or press F8.
.jpg?inst-v=6857700d-e803-410a-87dd-b39fd8a60a56)
Process Workload result (HTTP)
Send Statistical Information (HTTP)
Use this program to send HTTP logs to HaloENGINE.
Prerequisites:
HaloENGINE must be configured and in working condition.
Send to Central Server check box must be selected as described in the section "Configure Aggregation".
Follow the below steps to forward logs to HaloENGINE:
Call transaction /n/SECUDEH1/SEND_HTTP – Send Statistical Information (HTTP).
Click Display −> Change icon to edit the table.
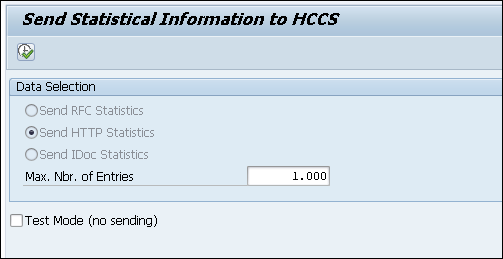
Send Statistical Information - HTTP
Enter the number of entries to be sent in one program run in Maximum Nbr. of Entries (defaulted to 1.000).
Select Test Mode (no sending) check box to run the program without sending it for testing purposes.
Click Execute or press F8.
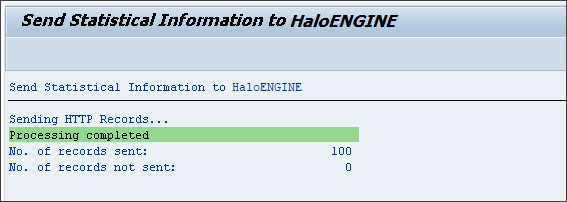
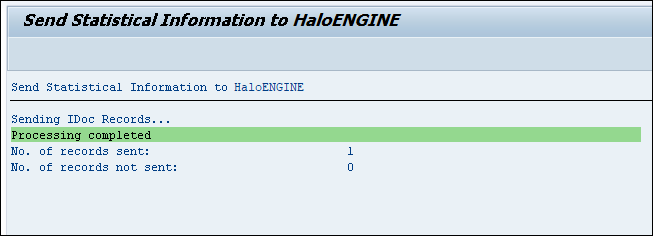
Statistical information to HaloENGINE
For illustration purposes, a sample HTTP log that is sent to HaloENGINE is shown below:
|
|---|
Reporting
HaloCORE DSI Dashboard
HaloCORE DSI Dashboard provides a simple and easy-to-understand visualization to give insightful information. It helps you to get an at-a-glance view of HaloCORE DSI.
Prerequisite:
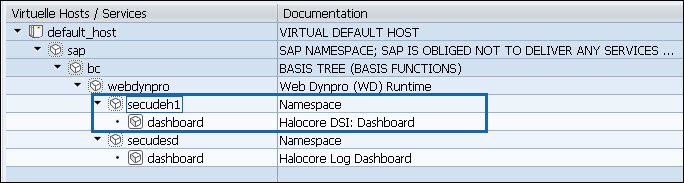
Enabling DSI dashboard
To view the dashboard, follow the steps:
Call transaction /n/SECUDEH1/DASHBOARD or, in a browser, enter the URL
[protocol]://[server]:[port]/sap/bc/webdynpro/secudeh1/dashboard(e.g.http://myserver.example.com:8443/sap/bc/webdynpro/secudeh1/dashboard).You will find the default dashboard and its settings, but you can change the settings as required.
You can filter based on the time range. Pre-set periods are Today, Yesterday, Last 7 Days, Last Month, Last Year; with Select Start/End Dates, you can also freely define an interval. (All dates are based on the current user's time zone.)
You can filter based on logged events:
RFC Calls (Inbound)
RFC Calls (Outbound)
HTTP/WS Calls (Inbound)
HTTP Calls (Outbound)
ALE/IDocs (Inbound)
ALE/IDocs (Outbound)
Downloads
Mails
Printing
You can filter based on partner entities (the list of entities is determined by the logical entities you have configured, plus those that are found in the data currently displayed)
You filter based on the classification (the list of attributes and values is determined by your system's classification set-up).
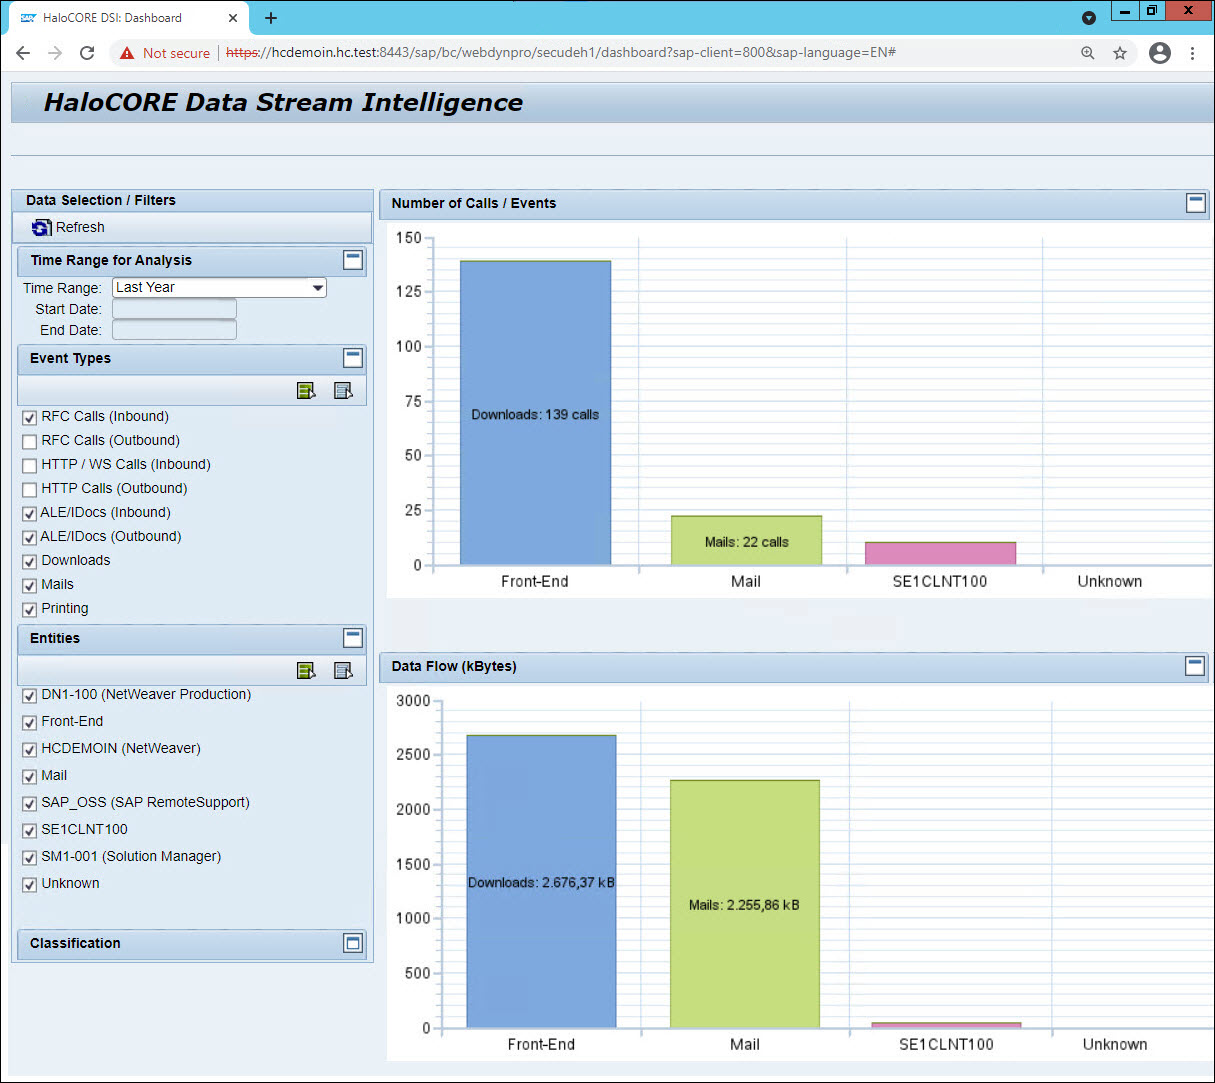
HaloCORE DSI Dashboard
Clicking the bar graph will take you to a detailed list of the aggregated data.
Display Data Streams
This program is mostly useful for test/diagnostic purposes. It displays log data from four different sources: HaloCORE (the Audit Log), RFC Log, ALE/IDoc Log, and HTTP Log as individual records, or summarized by the hour, day, week, or month.
Prerequisites:
BAdI WORKLOAD_STATISTIC must be implemented.
Programs /SECUDEH1/WLSTA_RFC and /SECUDEH1/WLSTA_HTTP must be scheduled (or run manually).
To display the log data, proceed as follows:
Call transaction /n/SECUDEH1/SHOW_LOG – Display Data Streams.
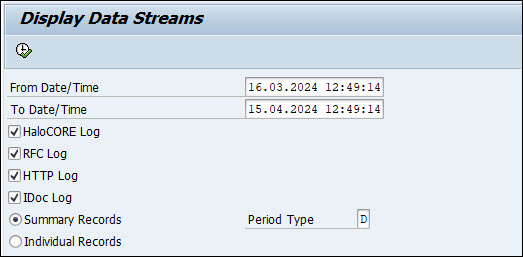
Display Data Streams
Select a specific date range in From Date/Time and To Date/Time fields.
Select the data source(s):
HaloCORE Log
RFC Log
HTTP Log
IDoc Log
Select a type of record:
Summary Records – Records will be summarized per time period (Hourly, Daily, Weekly, and Monthly).
Individual Records – Records will be displayed in one line for each event.
Click Execute or press F8.
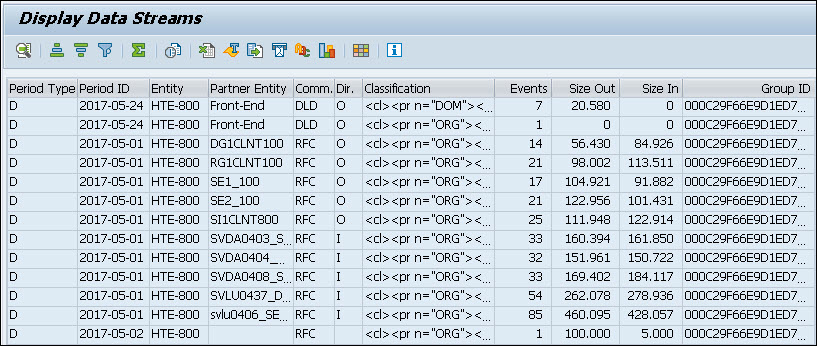
Display Data Streams log result
Log Administration
This program helps you to check/delete the log entries as per your selection criteria.
Prerequisite: To check or delete the log, you must have the following authorization.
Auth. Object | Field | Value |
|---|---|---|
J_9BH1_DE | ACTVT | 06 |
Authorization for deletion
Call transaction /n/SECUDEH1/DEL_STATS - Delete Statistical Information.
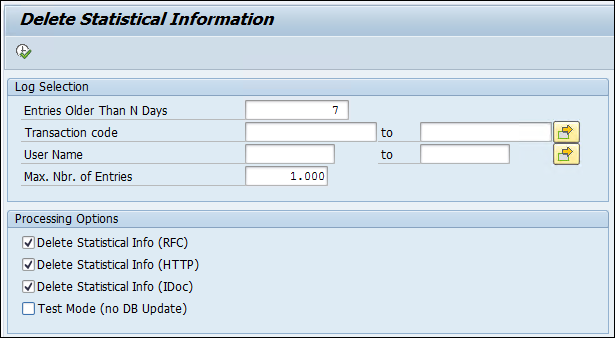
Delete Statistical Information
Under Log Selection, specify the following options as you need:
Enter the number of days in the Entries Older Than N Days box. Default value is 7 set via /n/SECUDESD/PARAMS_HC.
Enter the transaction code in the Transaction code box. The entries related to the specified tcode can be deleted.
Enter a user name in the User Name box. The entries related to the specified user name can be deleted.
Enter a number in Max. Nbr. of Entries box. The maximum number of log entries to be deleted at a time.
Under Processing Options, specify the following options as you need:
Select Delete Statistical Info (RFC) check box to delete the RFC entries.
Select Delete Statistical Info (HTTP) check box to delete the HTTP entries.
Select Delete Statistical Info (IDoc) check box to delete the IDoc entries.
Select Test Mode (no DB Update) check box to check the number of logs available for deletion as per set selection criteria, but no DB update will happen.
Click Execute to delete the logs. Note: If none of the processing options is selected, the log result will be displayed without deletion.
The Download Log Reorganization appears with the selected entries older than the specified day details, the number of matching records as per selection criteria, and the number of deleted logs.
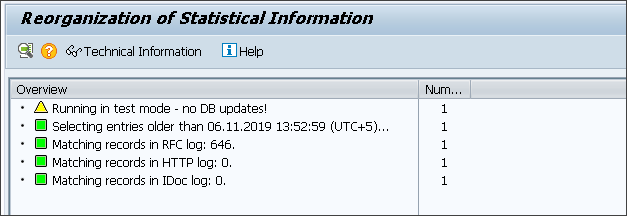
Delete Statistical Information results