
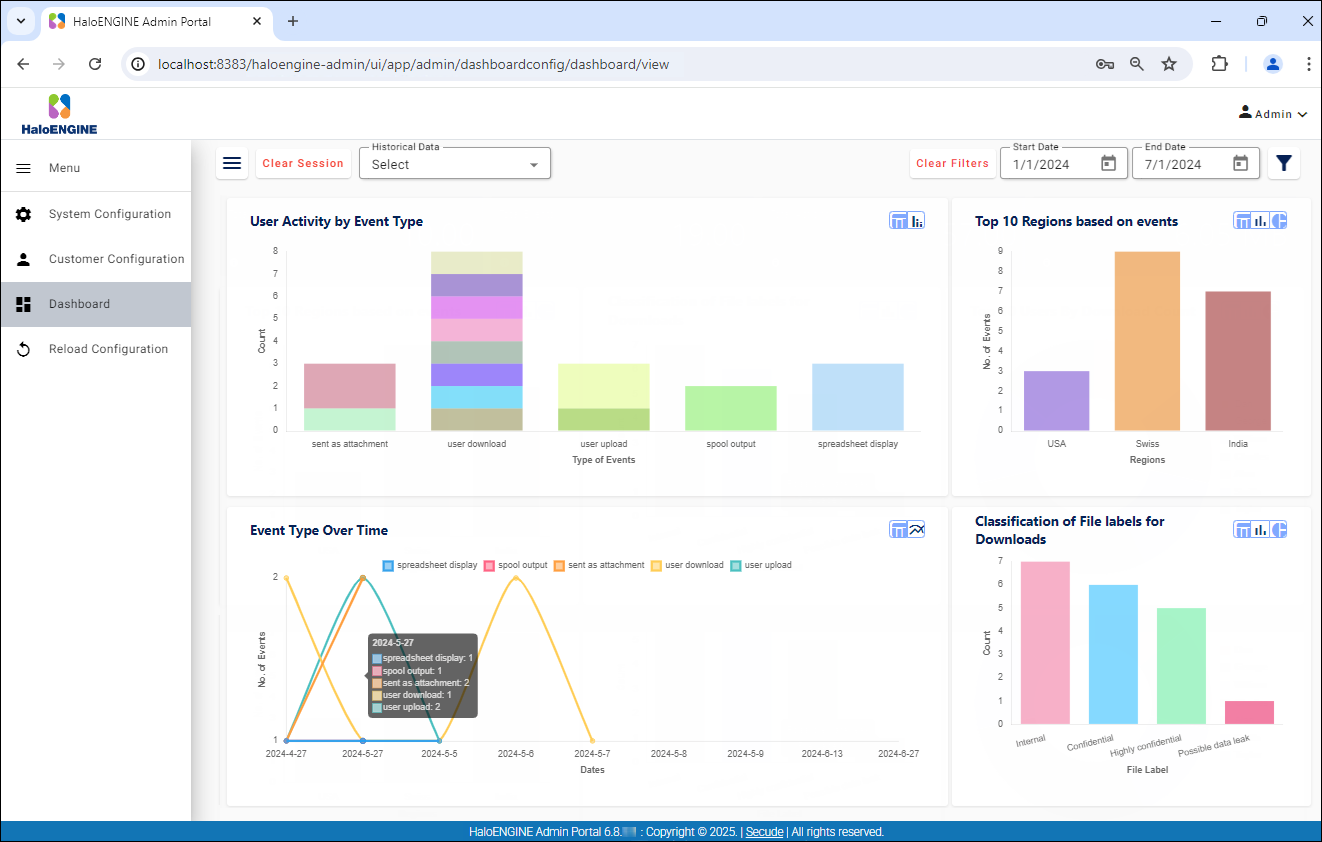
The HaloENGINE dashboard is an information management tool that visually monitors and displays important performance indicators and metrics, providing an overview of your company's data upload and download events. It uses tables, graphs, charts, and other visual components to display data. HaloENGINE may be viewed and updated in real-time, giving users accurate and up-to-date information when they need it. It is also possible to load a previously generated log file into the dashboard to get a visual picture.
As a prerequisite, make sure the database connection has been established. On the left navigation bar, click Dashboard. The following page is the default view. Note: If you receive a "Failed to get data" connection error, MongoDB may not have been installed or started yet. In that case, install MongoDB and/or start it manually.
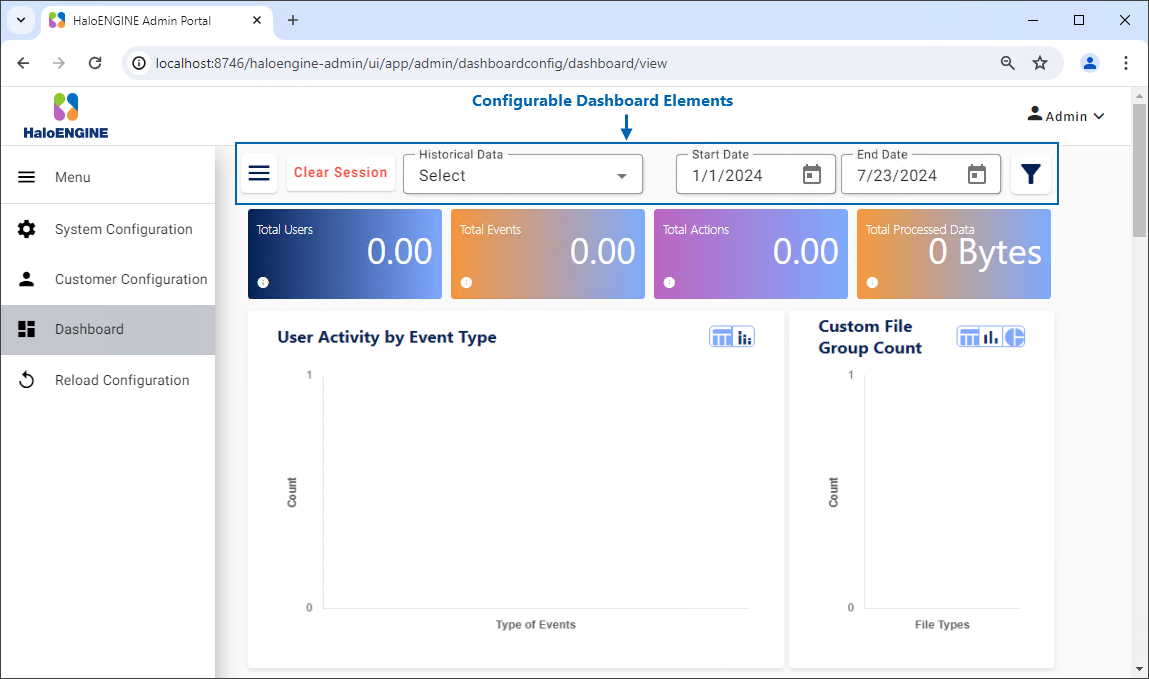
Default dashboard view
You can use several elements available in the dashboard user interface to personalize how your data is presented. The dashboard allows you to see both persistent and non-persistent logs.
Persistent log: This is real-time log data obtained directly from the HaloENGINE log files. If you want to review a log file permanently, you can upload it using the Upload Logs option. These logs are then displayed in the Historical Data section.
Non-persistent log: This option is useful when you need to access a previously saved log file or a log file from another HaloENGINE. Such log files can be uploaded using the Upload Logs option.
Upload Logs
Follow the steps below to upload a log file for both persistent and non-persistent options.
-
Click the Menu icon and then Upload Logs.
-
The Upload Log Files page will appear as shown in the figure below:
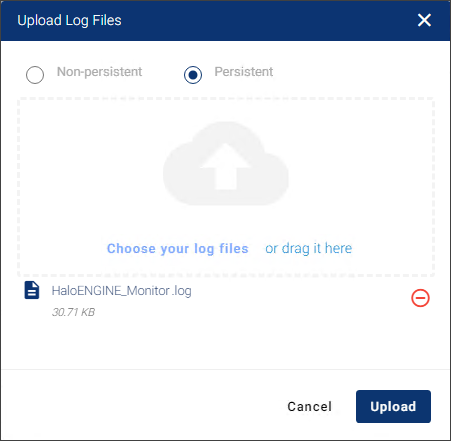
Upload log files
-
Select either the Non-persistent or Persistent option.
-
Upload or drag your log files to the page.
-
The name of the uploaded log files will appear in the list. If you want to remove an uploaded file, click the Remove this file icon.
-
Click Upload.
Results:
-
You will receive a confirmation message after successfully uploading the logs.
-
The dashboard presents the uploaded log file with visual features.
-
The populated data can be filtered by Historical Data, Products, and Date Range.
-
Customization
Dashboard logs allow users to customize the layout, design, and information based on their preferences. You can change the chart's layout or style by clicking on the Grid, Bar, or Pie elements.
-
The uploaded log IDs will appear in the list of Historical Data. By selecting one ID, the dashboard will automatically visualize the specified log entry. If you want to remove the uploaded data, click the Delete icon.
-
By selecting the Start Date and End Date in the calendar, the logged items will be displayed within that timeframe.
-
By clicking the More Filters icon, you can filter the Products, Events, Actions, Source Type, and Sensitivity Labels.
-
If you want to clear the filtered/selected data, click the Clear Filters button.
-
If you want to remove the uploaded Non-persistent log data, click the Clear Session button.
Scheduler
This option allows you to define the number of days the logs in the specified path should be maintained. Upon reaching a specified number of days, the logs will be automatically deleted from the MongoDB database.
-
Click on the Scheduler, the Scheduler File Path page will appear as shown in the figure below:
Scheduler file path
-
Click +Add Row, the fields will be visible on the page.
-
Enter the log path in Path. For example:
C:\Program Files\Secude\HaloENGINE\logs\customer_tenants\DELBONT INDUSTRIES -
Enter the number of days in Age that the log should be kept. For example: 10
-
Click Save.
Results:
-
You will receive a confirmation message after successfully configuring the scheduler.
-
The logs will be cleared after 10 days.
-
To add additional paths, click +Add Row and enter the information described above.
-
To remove a path, click the remove “X” icon.
-
Configure IP and Files
IP Config
This option allows you to specify the geographical location of the log entries. For example, if the U.S. is specified, log items associated with that region will be highlighted.
-
Click on the Configure IP and Files, and the Configure IP Address & File Groups page will appear as shown in the figure below:
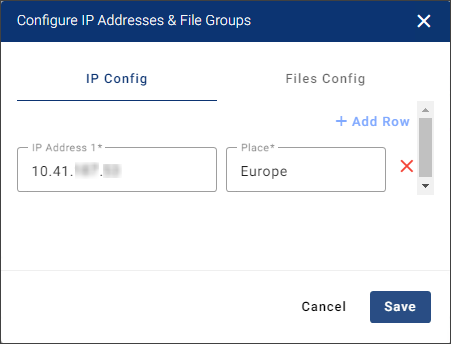
IP Config
-
Click +Add Row, the fields will be visible on the page.
-
Click the IP Config tab and enter the IP address and place. For Example:
-
IP Address:
10.41.*.* -
Place:
Europe
-
-
Click Save.
Results:
-
The IP Address data will be shown on the dashboard based on the provided log files.
-
To enter more IP addresses, click +Add Row and enter the details as above.
-
To remove an IP address, click the Remove icon.
-
Files Config
This option allows you to define file types. For example, if pdf is specified, log items that correspond to this file type will be highlighted.
-
Click on the Configure IP and Files, and select the Files Config tab.
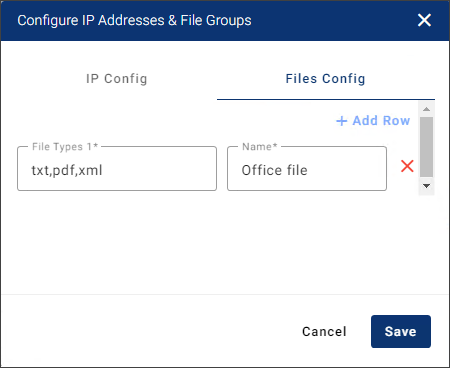
Files Config
-
Click +Add Row, the fields will be visible on the page.
-
Enter the file types and name of the file types. For Example:
-
File Types:
txt,pdf,xml -
Name: Office file
-
-
Click Save.
Results:
-
The file type data will be shown on the dashboard based on the provided log files.
-
To enter more file types, click +Add Row and enter the details as above.
-
To remove file types, click the Remove icon.
-
Select Charts
This option allows you to enable/disable the charts that will appear on the dashboard. You can rearrange the charts by dragging them in any order you prefer.
-
Click on the Select Charts, and the Select & Order Charts page will appear as shown in the figure below:
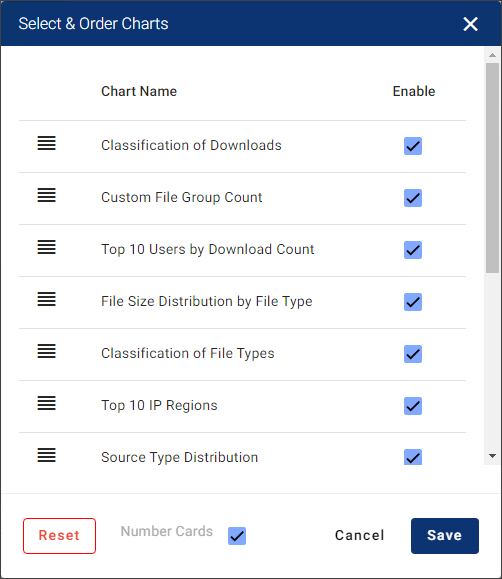
Select charts
-
Select the Enable checkbox next to each chart you want to appear on the dashboard, and then drag and drop them into the order you want them to appear.
-
Click Save.
Results:-
You will receive a confirmation message after successfully configuring the chart order.
-
The charts will be displayed in the given order.
-
To restore the charts to the default view, click Reset. You will receive a confirmation message saying “Are you sure you want to reset to default” click Yes to confirm.
-
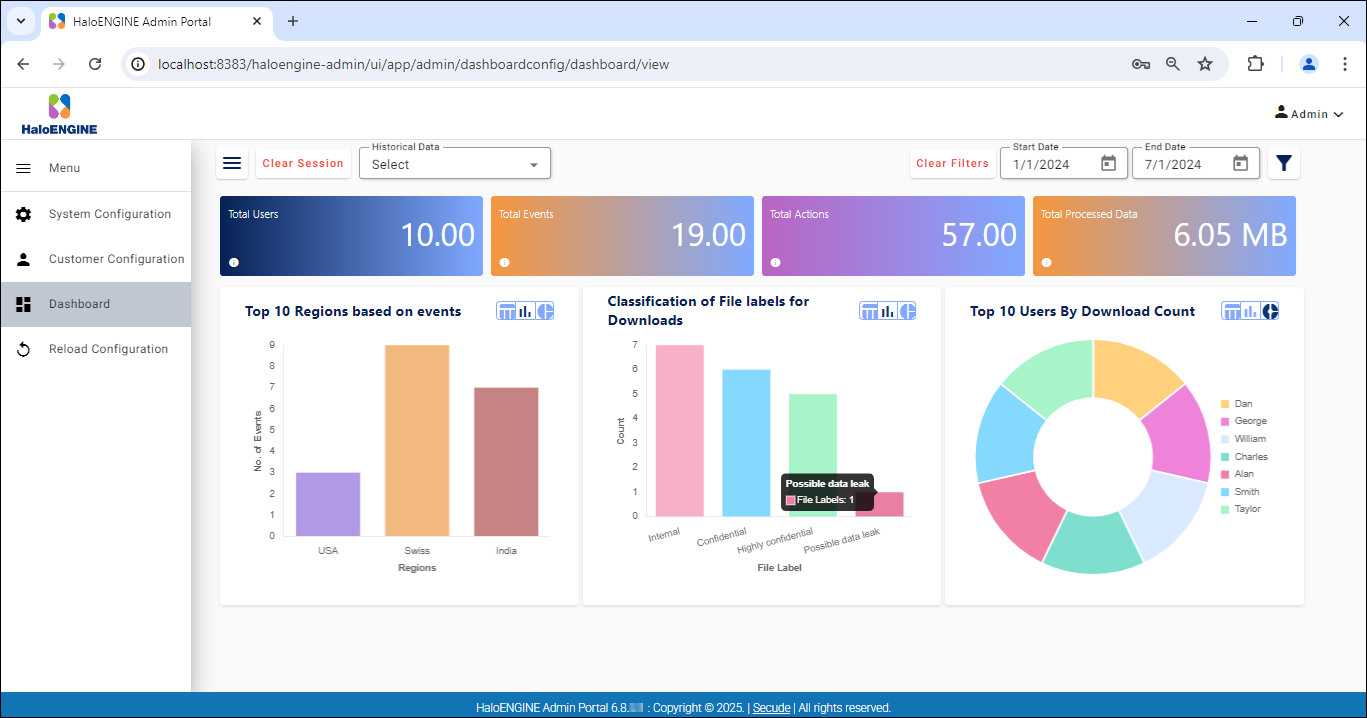
Number Cards are displayed at the top of the dashboard to show the records. Key metrics such as total users, total events, total actions, and total processed data are displayed. Select the Number Cards check box to display the cards, or uncheck it to hide them.
-
Sample Screens
Sample 1
Sample 2